

👁️🗨️ Kubernetes Monitoring 🚀
PRAFUL PATEL ☁️🚀, Highly skilled and motivated Cloud Engineer with a proven track record of designing, implementing, and managing robust cloud infrastructure solutions. With years of hands-on experience, I am deeply passionate about creating scalable and resilient cloud architectures that drive innovation and deliver optimal business outcomes. 🛠 Key Competencies:
Cloud Platforms: AWS, Azure, GCP, OCI Infrastructure as Code: Terraform, Ansible Containers & Orchestration: Docker, Kubernetes Scripting: Python, Bash/Shell CI/CD & Version Control: GitHub, Jenkins, CircleCI Monitoring & Analytics: Grafana, Prometheus, Datadog, New Relic Backup & Recovery: Veeam Operating Systems: Linux, Windows DevOps Tools: AWS Code Build, Code Pipeline, Azure DevOps
📚 Continuous Learning: Staying ahead in the rapidly evolving cloud landscape is my priority. I am committed to expanding my skill set and embracing emerging cloud technologies to drive efficiency and innovation. Passionate Cloud/DevOps enthusiast dedicated to designing, building, and deploying cutting-edge technology solutions. As a devoted YouTuber, I love sharing insights through informative videos and crafting technical blogs that delve into areas like ☁️ Cloud, 🛠️ DevOps, 🐧 Linux, and 📦 Containers. 💻 Open Source Advocate: Contributing to open-source projects is a vital part of my journey. I actively engage in projects centered around Cloud, DevOps, Linux, and Containers, fostering collaboration and innovation within the community. 💌 Let's Connect: I am enthusiastic about virtual collaborations and meeting fellow professionals. Let's explore how I can contribute to your organization's cloud goals. Feel free to connect or DM me.
🌐 Portfolio: Check out my portfolio 🔗 LinkedIn: Connect on LinkedIn 🛠️ GitHub: Explore my projects 🎥 YouTube: Watch my videos 📝 Medium: Read my articles 🌐 Dev.to: Check out my posts
📊📈 Prometheus & Grafana 👁️🗨️
📈 Visualize Cluster Information in Dashboards:
- Use Grafana to create dashboards that display essential cluster metrics, such as CPU and memory usage, node health, and pod status.
📚 Pull Custom Application Logs via Sidecar:
- Implement a sidecar container in your pods to extract custom application logs and make them available for monitoring.
💻 Create Dashboards as Code for Easy Editing:
- Opt for Infrastructure as Code (IaC) to define and manage your Grafana dashboards. This ensures easy editing, version control, and reproducibility of your monitoring setup.
Embrace Prometheus and Grafana to gain valuable insights into your Kubernetes cluster's health and performance. 🌐🔍 #KubernetesMonitoring #Prometheus #Grafana 🛠️
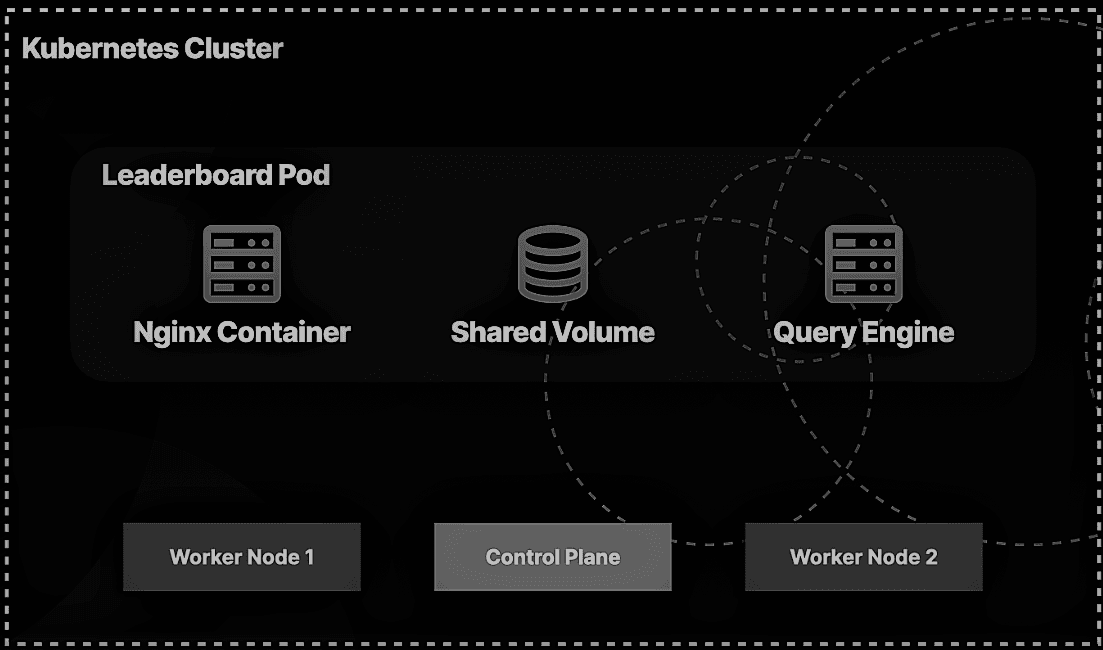
🚨 Incident Response Scenario: Leaderboard Service Outage 🚨
Scenario: You are a Container Engineer responsible for maintaining an e-commerce platform's critical leaderboard service. This service displays the top-selling products on the platform. Suddenly, you receive an urgent alert notifying you that the leaderboard service is down, and it's impacting the user experience. Your task is to quickly respond to this incident, diagnose the issue, and restore the service to its normal working state.
Role: Container Engineer 🐳 Platform: E-commerce 🛒 Service: Leaderboard 🏆
📅 Real-time Actions:
🔥 Immediate Alert Acknowledgment: You swiftly acknowledge the alert, notifying your team that you're diving into the incident.
📊 Monitoring and Logging Tools: Access real-time data using monitoring tools like Prometheus and Grafana to gauge cluster health and resource use.
🕵️ Kubernetes Cluster Status Check: Utilize
kubectlto confirm the Kubernetes cluster status. Ensure it's not a global cluster issue, inspect nodes and control plane components.📜 Leaderboard Service Logs: Check service logs for error messages with
kubectl logsand evaluate recent events.📦 Pod Inspection: Run
kubectl get podsto list all pods, including the leaderboard pod. Spot the "Failed" status.🔍 Troubleshooting the Pod: Use
kubectl describe pod <pod-name>to uncover details about the failure, including resource and mounting issues.💾 Resource Check: Review resource requests and limits in the pod configuration to avoid resource starvation.
🔄 Rolling Restarts: If issues are found, trigger a rolling restart by updating the Deployment to create fresh pods.
👨⚕️ Health Checks: Ensure liveness and readiness probes in the deployment are correctly configured.
🌐 Integration and Network Issues: Investigate integration and network problems within the cluster.
🔌 Database Connectivity: Verify the leaderboard service's ability to connect to the database, essential for fetching sales data.
📦 Docker Image: Confirm availability and correctness of the Docker image in the deployment configuration.
🛡️ Service Checks: Confirm the Kubernetes service correctly routes traffic and is reachable.
🔄 Backup and Rollback Plan: Maintain a rollback plan in case of prolonged issues. Consider implementing a backup mechanism for a default leaderboard.
📝 Documentation and Communication: Document all actions and updates, keeping the team and stakeholders informed.
✅ Resolution and Verification: After addressing the root cause, verify that the leaderboard service is operational and meets performance expectations.
🔍 Post-Incident Analysis: Conduct a post-incident analysis to understand the cause, document lessons learned, and implement preventive measures.
In this real-time scenario, swift response, a systematic troubleshooting approach, and effective communication are vital to minimize downtime and maintain a positive user experience on the e-commerce platform. #IncidentResponse #Kubernetes #Ecommerce #ContainerEngineer
👀 Monitoring Priorities 👀
1. Node Health:
- 🏥 Monitor node health to ensure each node in the cluster is running smoothly.
2. Cluster CPU/Memory Capacity:
- 💻 Keep an eye on cluster-wide CPU and memory capacity to prevent resource bottlenecks.
3. Pod Health Checks:
- ❤️🩹 Implement health checks for pods to detect issues and ensure they're in a healthy state.
4. Networking:
- 🌐 Monitor network traffic and connectivity to guarantee seamless communication between pods and services.
5. Application Logs:
- 📋 Collect and analyze application logs for insights into app behavior and potential issues.
Objectives:
1. Identify Pod Configuration Error:
- 🕵️♂️ Identify the error within the pod's configuration causing the app malfunction.
2. Update Pod Configuration:
- 🔄 Revise the pod's configuration to bring the app back to its expected, functioning state.
Incorporating monitoring and addressing configuration issues are key elements of maintaining a healthy and operational Kubernetes environment. 🚀
Observer the working nodes

Observe the running workloads

Get more information about the pod leaderboard


Check the logs for 'query-app' container

Some one had typo in the commands 'ech' which caused an error

2. Update Pod Configuration:
- 🔄 Revise the pod's configuration to bring the app back to its expected, functioning state.
Export the leaderboard pod configurations into a leaderboard.yaml file:
kubectl get pod leaderboard -o yaml > leaderboard.yaml Open the file:

vim leaderboard.yaml Edit the command to be echo instead of ech.

Save and exit the file by pressing Escape followed by wq.
Attempt to update the pod:
kubectl apply -f leaderboard.yaml We can't update the command key for a running pod, so you'll see an error instead.

Delete the pod:
kubectl delete pod leaderboard Confirm it's gone:


kubectl get pods Re-create the pod:
kubectl apply -f leaderboard.yaml Confirm it exists:

kubectl get pods Check the logs for the updated query-app container:

kubectl logs leaderboard -c query-app Get the pod description again:

kubectl describe pod leaderboard


#KubernetesMonitoring #PodConfiguration #AppMaintenance 🛠️


